Houston's Seasonal Employment Patterns
How contract cycles create predictable job losses twice a year
 Christine / Flickr / CC BY-NC-ND 2.0
Introduction
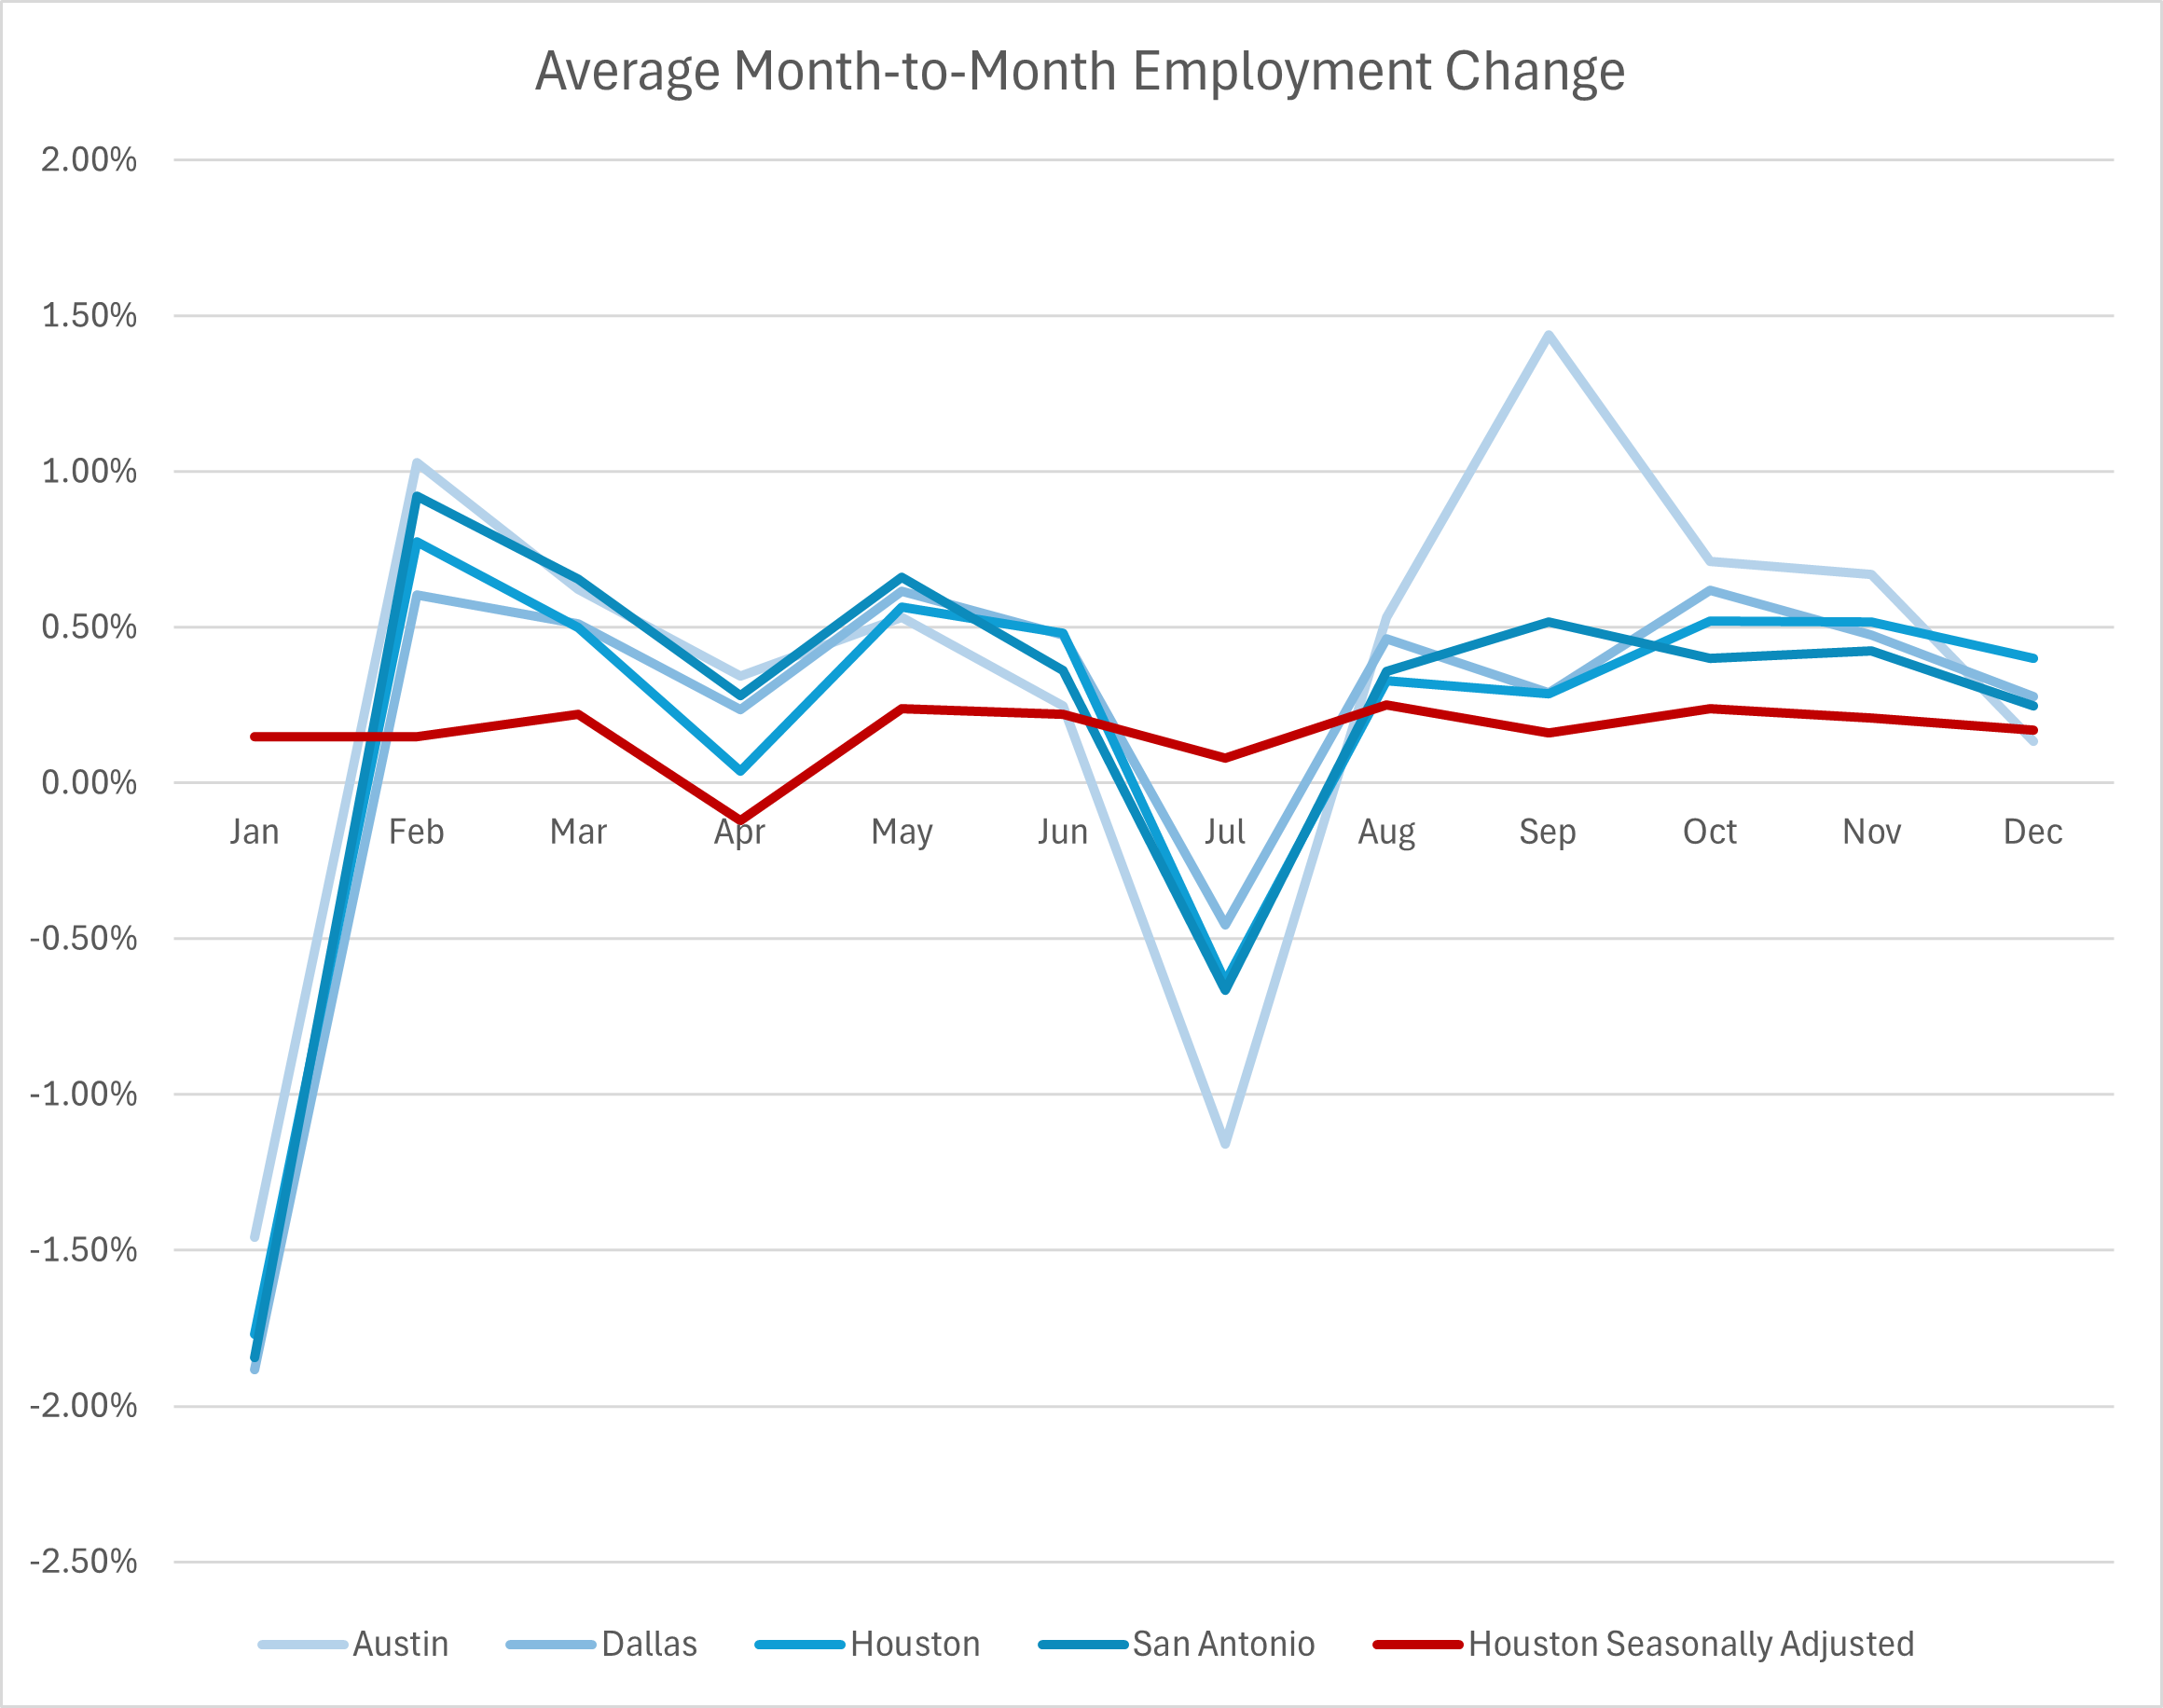
In January, Houston typically loses 1-2% of its employed non-farm workforce. Using monthly, non-seasonally adjusted employment data from FRED, I analyzed Houston’s employment patterns alongside other major Texas metro areas from 1990 to 2025. The data reveal a consistent “double-dip” seasonal pattern. Employment drops sharply in January and experiences a secondary dip in July, despite consistent growth during all other months.
Analysis
The January decline is substantial and predictable. Houston’s employment falls by an average of 1.77% each January, translating to approximately 40,000 jobs based on current employment levels. This is followed by a rebound in February, which makes it one of the highest growth months. Across the other major metro areas in Texas, we see the following January employment changes:
| Metro Area | Average Jan Employment Change | Average Feb Employment Change |
|---|---|---|
| Austin | -1.46% | 1.03% |
| Dallas | -1.88% | 0.61% |
| Houston | -1.77% | 0.77% |
| San Antonio | -1.84% | 0.92% |
This January decline shows the combination of post-holiday seasonal position layoffs and the end of annual employment contracts. The less pronounced drawback in July likely has a similar explanation. Similar to annual employment contracts being associated with January’s decline, layoffs in July are probably caused by temporary employment contracts expiring.
Running a simple regression analysis with dummy variables, we see that the calendar month alone explains ~51% of the variation in Houston’s month-to-month employment changes since 1990. This R-squared value demonstrates that seasonal factors are more of a dominant driver of employment fluctuations than just noise. Remaining variation comes from business cycle effects, economic shocks, and industry-specific trends.
This finding underscores why economists and policymakers rely on seasonally adjusted data when analyzing labor market health. Without accounting for these predictable patterns, raw employment figures would suggest economic recession in Houston twice every year. The Bureau of Labor Statistics and Federal Reserve banks use sophisticated seasonal adjustment methods to remove these annual effects, allowing analysts to differentiate between genuine economic trends and seasonal variations.
Conclusion
For anyone following Houston’s economy, understanding these patterns provides context for interpreting employment reports. Upcoming jobs figures for January 2026 may look dramatic, especially looking at the raw number of jobs lost. However, by looking in the long term and removing seasonality from data (combined with regular backwards revisions) we can get a better view of economic trends of the region.